25
Mar
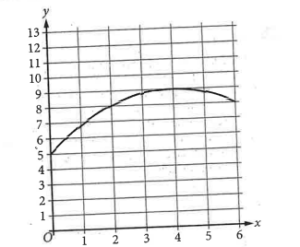
The graph models the number of active projects a company was working on x months after the end of November 2012, where 0 ≤ x ≤ 6. According to the model, what is the predicted number of active projects the company was working on at the end of November 2012?